November 2013 Sunspots: Trends

The monthly International Sunspot Number from the Solar Information Data Center (SIDC) of the Royal Observatory of Belgium was released December 1st. It fell to 77.6 spots/day.
Most newsworthy is that this is still the weakest solar max in over 100 years, well below NASA’s forecast.
Equally important for Earth’s future climate is an emerging pattern in overall sunspot magnetic field strength. Its decline is no longer linear!
Strangely, practically all the sunspot activity last month was in the sun’s southern hemisphere. It accounted for 61.2 of the total. That’s its highest activity level of Cycle 24.
On the other hand, the northern hemisphere only managed a paltry 16.4. That’s its lowest count since before solar max three years ago. Northern sunspot activity is pretty much done.
Sunspot activity in November backed off from October’s incredible burst to 85.6. Activity peaked mid-month with 5 strait active days where spot counts rose to over 100. By month’s end, though, it backed off to the mid-60s. Northern spots were down to just 8 by month’s end.
We may be witnessing the sun’s last dying gasps before entering into a long slumber. The impact of that slumber on Earth’s climate remains the subject of growing scientific speculation.
Disappearing Sunspots

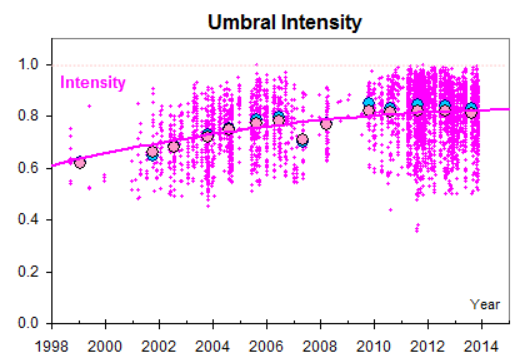
Its been known for years that sunspot umbral magnetic field strength has been declining while their intensity has been rising, thanks to researchers Matt Penn and Bill Livingston at the National Solar Observatory.
The changes are independent of the 11-year sunspot cycle.
A steady decline in umbral magnetic field strength is the most dramatic evidence that sunspots are fading away. Should their field strength drop below 1,500 gauss it becomes physically impossible for sunspots to form and they will disappear.
Less sunspot activity reduces the sun’s radiant energy output and cools Earth.
Shown in the latest measurements above, a transformation has appeared as more data has been gathered and refined.
When magnetic field strength weakening was first discovered it was a steep linear decline that appeared would dip below 1,500 gauss before 2025.
But now, the decline has flattened and become more concave. It looks as if it may level off close to, but above the magic 1,500 gauss level. At the same time it looks like umbral intensity is curving back the other way to.
Conclusions
Several trends in sunspot activity for this cycle are becoming clear.
First, northern sunspot activity is near its end while southern activity is at its zenith. The only drama left is when will southern spot polarity reversal occur. That is expected any time. The sun right now is a magnetic monopole. The sun will finish its inexorable journey to sunspot minimum after southern sunspot polarity reversal occurs.
The decline in sunspot magnetic field strength is continuing, but showing signs of leveling off along a shallow concave curve. Umbral intensity is showing a similar change in the reverse.
Sunspots may not disappear completely, but they will be so weak that a long term decrease in solar wind and a slight but prolonged decrease in the sun’s temperature will result.
The latest solar data from this month reinforces the belief that our sun is headed into a long-term period of low solar activity.
As time goes on a link between decreasing solar activity and the halt in global warming 17 years ago becomes harder and harder to deny.
——————————————————————————————————————————–
Correction:
The current cycle – Solar Cycle 24 – is the weakest in over 100 years; not 200 years as previously written.
According to SIDC records, the highest smoothed monthly peak in sunspots so far this cycle is 66.9. That is likely its highest. Cycle 14 peaked a little less than that at 63.4 in June of 1905.
——————————————————————————————————————————–
Posted on Dec 14, 2013, in Business, Climate, climate change, economics, Energy, environment, nature, news, Politics, science, space, Sun, sunspot report, sunspots. Bookmark the permalink. 31 Comments.


We are witnessing the consequences of 68 years of government deception intended to save the world from possible nuclear annihilation by hiding the source of energy in cores of heavy atoms, some planets, ordinary stars and galaxies.
But the struggle to reveal the Sun’s pulsar core has succeeded, despite decisions by frightened world leaders in 1945 to:
1. Form the United Nations on 24 October 1945
2. Hide neutron-repulsion in cores of atoms & stars
The Sun’s pulsar core is the
1. Creator of every atom, and the
2. Sustainer of every life
in the solar system.
Chapter 1 of my autobiography described the start of my research on meeting Professor Kuroda in May 1960.
Click to access Chapter_1.pdf
Chapter 2 used precise experimental data to provide clear and unequivocal evidence:
1. Neutron-repulsion is the source of energy in cores of heavy atoms and stars
2. The Sun made our elements, birthed the solar system and sustains our lives,
3. Iron-56 is the most abundant and most stable atom in the Sun and the Earth
Chapter 2 compares solar and nuclear science before and after the Second World War:
1. Astronomers and astrophysicists believed the interior of the Sun was mostly iron (Fe) before the end of the Second World War, but after the Second World War ended they unanimously changed their opinions without discussion or debate in 1946 to conclude the Sun’s interior is mostly hydrogen (H).
2. Scientific textbooks used F. W. Aston’s rigorously valid “nuclear packing fraction” to indicate nuclear stability before the end of the Second World War, but after the Second World War ended most textbooks replaced Aston’s “nuclear packing fraction” with C. F. von Weizsäcker’s deceptively convincing “nuclear binding energy.” The latter obscures neutron-repulsion with high values for the binding energy of neutron-rich atoms and low values for the binding energy of proton-rich atoms.
Click to access Chapter_2.pdf
The New Year brings these formidable challenges. How can we:
1. Retain social advantages from the decision to form the United Nations?
2. Restore integrity to government science and constitutional governments?
Thanks for your efforts in this regard.
Best wishes for the Holidays and the New Year,
– Oliver K. Manuel
E.M. Smith has interesting views on TSI:
http://chiefio.wordpress.com/2013/12/15/does-anybody-real-know-what-tsi-it-is/
Uh oh. No, the sun is NOT a magnetic monopole. Based on any/all available experimental data, all of the sun’s magnetic field lines ultimately form closed loops, in full accordance with the known laws of physics. (Prove otherwise and a Nobel prize in physics can be yours.) Unfounded assertions that the sun can have one pole of a magnetic field without also having the other could be avoided by consulting with just about any physicist, prior to posting your essays. Other than that, I enjoyed your article. Thank you.
Theoretical physicist Paul Dirac, who predicted the existence of magnetic monopoles, already got the Nobel Prize back in the 1930s. 🙂
The sun is not a normal magnet. It has a very complex, dynamic magnetic field that is greatly affected by magnetohydrodynamic effects. It reverses polarity every 11 years at solar maximum activity as a normal part of the solar sunspot cycle. We are at peak activity for the current cycle – Cycle 24 – right now.
(Sunspots themselves are gigantic magnetic storms)
Magnetic field reversals at the geographic poles do not always happen at the same time. One hemisphere can get ahead of the other. I don’t know if anyone knows why that happens.
For example, in the current cycle solar max for the sun’s north geographic pole occurred in late 2011. The south pole is just now reaching its maximum.
The north pole reversed polarity well over a year ago. The magnetic field lines at the sun’s surface right now are all generally pointing in the same direction (solar physicists call it a “unipole” situation) and will remain so until the southern hemisphere reverses polarity. That may be happening right now.
Thanks for the informative comments, but regardless of the complexity (and no doubt, it is complex) of the sun’s magnetic field, it is still NOT a monopole. I.e., the integral over a sphere surrounding the sun of the scalar product of the magnetic field vector with the normal to the surface of that sphere = 0. Like I said, prove otherwise and you’ll (quite rightfully) deserve a Nobel prize in physics. No kidding. To this day, there is no accepted experimental evidence of the existence, anywhere in the universe, of a magnetic monopole. One (or more) may be found someday. Meanwhile, no serious physicist thinks the sun is a magnetic monopole, or that it will be one soon, or that it has been one in the past.
Dr. Todd Hoeksema, the Director of Stanford University’s Wilcox Solar Observatory, has been monitoring solar magnetic fields on a daily basis for decades. Here is a chart plotting a timeline of his measurements from May 1976 up through November 13th, 2013:
http://www.solen.info/solar/polarfields/polar.html
Look to the far right hand side of the plot just below the legend. There are vertical lines that show, among other things, when each pole of the sun switches polarity and their field strength in microTeslas.
According to Hoeksema’s data the north geographic pole reversed magnetic polarity around May of 2012 (blue dashed line) and the south pole just reversed polarity in September 2013 (red dashed line).
As you can see in the plot, between May 2012 and September 2013 the polarity of both the north and south poles at the sun’s surface were net positive! The sun had north magnetic poles in each geographic hemisphere and no south magnetic pole.
The physical fact is that it is not unusual for both the north and south geographic poles at the sun’s surface to have net magnetic fields pointed in the same direction near solar max activity… regardless of what is happening below the surface.
For example, near solar max of Cycle 22 you can also see there was another period lasting a year or so when the sun was net positive, magnetically speaking, in both geographic hemispheres.
It has happened before and will happen again.
It cannot be determined if periodically looking like a weak monopole at it’s surface makes the sun a “real” monopole or not.
All that can be said for sure is that, according to Hoeksema’s data, it briefly looks like one!
Read the article, but you are forbidden from inferring any impact to Earth’s climate based on the activity of the Sun. Because, denier!!!
Huh? I’m not making any inferences. I just report facts. Since the late 1970s satellites have measured variations in solar radiant energy output of about +/- 0.1 degrees C every solar cycle. The sun is coolest during sunspot minimum activity.
The IPCC has correctly pointed out that +/- 0.1 degrees C is not enough to make much difference on Earth. However, we don’t know what happens to radiant energy output during prolonged solar minimums, such as during the Maunder and Dalton minimums.
What we do know is that during periods of prolonged solar minima that Earth has experienced cooler temperatures.
Most solar physicists believe we are headed into another Dalton or Maunder type minimum next cycle, so we will find out.
Don’t believe me…
Scientific speculation about what might happen are found in these places:
http://phys.org/news/2013-11-calm-solar-prompts-impact-earth.html
http://www.newscientist.com/article/dn24512-solar-activity-heads-for-lowest-low-in-four-centuries.html
http://www.newscientist.com/article/dn24512-solar-activity-heads-for-lowest-low-in-four-centuries.html#.UquHruLYFP0
http://www.smh.com.au/technology/sci-tech/calm-solar-cycle-prompts-questions-20131124-2y46p.html
http://en.wikipedia.org/wiki/Little_Ice_Age#Solar_activity
David Ferguson was just reminding the reader that all roads lead to anthropogenic global warming. He just forgot his tags. But thanks for the other links!
Oops, that was supposed to say, “He just forgot his sarc(asm) tags.”
Total TSI is probably a “red herring.”
The ratio of IR to UV radiation changes over the solar cycle, as recently reported by Judith Lean (as I recall).
Changes in solar radiant energy output are measured by changes in temperature? Of exactly what, precisely where, when and how often?
Wouldn’t joules, or joules per unit time be more valid measures of stellar energy output?
TSI = (joules/time(in seconds))/(meters squared)
Essentially, TSI is a measure of energy per unit area. It delivers the energy that sets the black body energy content of Earth (its temperature).
When I was a student TSI used to be called the “Solar Constant” because it was believe that the sun’s total energy output never varied. It wasn’t until the satellite era that it became apparent that the sun is a variable star.
It seems to me that if you reduce TSI over a long enough period of time that it will necessarily result in a measurable decrease in the black body temperature of Earth. It may not be a large decrease, but a decrease nonetheless.
Also, a long term reduction in solar wind intensity, CMEs and solar particles might affect cloud formation that affects albedo… that, in turn, affects climate.
The latter might have more indirect influence over Earth’s temperature and climate than TSI does directly.
But that is pure speculation.
But that is pure speculation.
None of which explains why you cited a temperature reading as a ‘fact’ that indicates solar output remains constant.
Just who is reporting solar output measured in degrees, on any scale, and exactly what are they purporting to measure to obtain those results?
Nobody reports solar energy output as a temperature. It isn’t a temperature. It is an amount of energy per unit area.
It has always been reported as watts per square meter at Earth’s distance from the sun.
For the record, scientists call the sun’s energy output TSI for Total Solar Irradiance.
Currently TSI is around 1,366 watts per square meter. It has ranged between 1,365 and 1,367 over the last 38 years.
Though not a temperature measurement, if TSI were doubled it would get a lot hotter around here and if it decreased by half it would get a lot colder. 🙂
It’s even more interesting when you include Cycle 22 into the graph:

It does. That also covers the same time frame that Penn and Livingston have documented the sharp decline in sunspot magnetic field strength.
But if we just pay more for fossil fuels the problem will be fixed.
Winter is coming…
Comparing the lead chart to the patterns in this one
http://sidc.oma.be/sunspot-index-graphics/wolfaml.php
would appear to suggest we are heading towards similar solar patterns as existed in the periods 1800 to 1840 or 1880 to 1920.
The SIDC’s sunspot record appears to show a dip in sunspot activity near the beginning of each of the previous 3 centuries. That being the case, then we are right on schedule.
Well clearly this means that the earth will become increasingly warmer with inconvenient rising sea levels. Obviously.
For information on the Sun’s influence on Earth’s climate, see:
Click to access grand_minimum.pdf
Fascinating article!
I find their forecast particularly noteworthy given that the decrease of -0.8 degrees C by around 2015 is approximately the same amount and time length that Earth has warmed since 1880. That temperature rise is the main IPCC evidence for global warming.
When you look at temperature change since 1880, though, it does not correlate at all well to the smooth linear increase in global CO2 observed over time. Actual temperature rise has come in staccato steps and is not smooth like it should be if all that increase were caused by CO2 increase alone (as claimed by the IPCC).
Just as fascinating is the referenced paper- Shapiro A.I. et al. “A new approach to the long – term reconstruction of the solar irradiance leads to large historical solar forcing”, Astron. Astrophys. 2011; 529: A67 – which establishes a TSI proxy record over time.
That paper provides pretty solid evidence from a variety of sources that TSI has varied enough over time to be a major player in long-term climate change!
As the years pass, the suggestion that global warming halted 17 years ago becomes more difficult to sustain.
Only by using a statistical trick is it possible to claim a pause, i.e. by starting with 1998, the most extreme el niño year of the 20th century, and considering only one year at a time. Arguably global mean surface temperatures in 2005, 2010 and 2013 equalled or exceeded 1998. Even the coolest years since 1998 have been warmer than any year before 1997 with the possible exception of 1990.
The variations in total solar irradiance between 1366 and 1368 watts per sq m are shown to be insignificant in comparison with the rise in CO2 concentration from its million-year natural range of 180-280 parts per million (ppm) until 1750, to around 400 ppm now.
The increase in temperature will not be smooth due to interchange of heat at the atmospheric/ oceanic surface. The oceans hold far more heat energy than the atmosphere does.
Pingback: November 2013 Sunspots: Trends | Inform The Pundits! | Solar Flare 2012
Pingback: Sun Has Weakest Solar Max In Over 200 Years | The Global Warming Policy Foundation (GWPF)
Pingback: The Climate May Be Changing, But It’s Sure Not Getting Warmer | The Lonely Conservative
Pingback: ‘Islamophobia’ Scam, State of Deception, Leading From Behind, More | IOWADAWG'S BLAWG
Pingback: Climate News – December Edition 2 |
Pingback: VT Energy Goals, Carbon Tax, and Climate Change: Examining priorities for VT Legislature in 2014 — True North Reports